Reflections on Gold as We Approach 2026

I started writing this blog in 2020 to share my views on macroeconomics and long-cycle investing. My very first piece was a strong call on gold. At the time, I argued that gold was likely to be one of the best investment opportunities of the coming decade. The framework was admittedly abstract: deeply negative real rates, de-globalization pressures, high debt and low growth as the post-pandemic equilibrium, persistent monetary accommodation, and a rising inflationary undercurrent. History suggested that under such conditions, gold will ultimately enter a super-cycle.

Five years later, gold’s price path has unfolded broadly along that thesis. Looking back, the feeling is less triumph than humility. The original conviction was built on a conceptual framework, not on any concrete forecast of events. While extreme real rate dynamics were part of the story and largely within expectations, the actual path the world took was far more dramatic than anyone could have sketched out. We witnessed a major policy misjudgment by the Fed that allowed inflation to surge to 9.1%. We saw aggressive tightening burst the innovation-era bubble, wiping out fragile startups and triggering a regional banking crisis.

My deepest conviction back then, however, went beyond gold as a short-term hedge or even a medium-term real-rate proxy. At its core, gold is a long-term measure of dollar credibility, the monetary reference point against which the dominant country of a Kondratiev cycle is ultimately judged. I believed that as contradictions accumulated, some form of systemic re-ordering was inevitable. What I could not have imagined was how explicitly that process would reveal itself.

The Russia-Ukraine war in 2022, followed by unprecedented financial sanctions and the freezing of sovereign reserves, delivered a profound shock to the notion of dollar neutrality. That moment marked the opening act of de-dollarization—not as ideology, but as risk management. Central banks stepped in as structural buyers of gold. By 2025, escalating tariff conflicts, violent swings in the Treasury market, and the erosion of Treasuries’ safe-haven status further reinforced a simple conclusion: gold had become the only uncontested refuge, effectively replacing U.S. government bonds in the global safety hierarchy.

Over the past five years, maintaining a meaningful allocation to gold has been both intellectually validating and financially rewarding. And as we stand here today, my bullish view on gold remains firmly intact. In what follows, I want to revisit the logic, updated with lived history, and lay out why the forces driving gold higher continue to build as we look toward 2026.

I believe gold is being driven by three distinct forces. The two dominant ones are de-dollarization and safe-haven substitution, while currency debasement, as captured by the real-rate framework, plays a secondary role. In other words, as long as de-dollarization and the repricing of safe assets remain intact, fluctuations in real rates—no matter how dramatic—may create volatility, but are unlikely to alter gold’s long-term upward trajectory.

The first, and by far the most dominant factor, is de-dollarization.

The traditional debasement framework for gold anchored in real rates worked remarkably well before 2022. That relationship, however, began to break down in 2022, when gold sharply disconnected from U.S. real yields under the influence of a new force: de-dollarization.

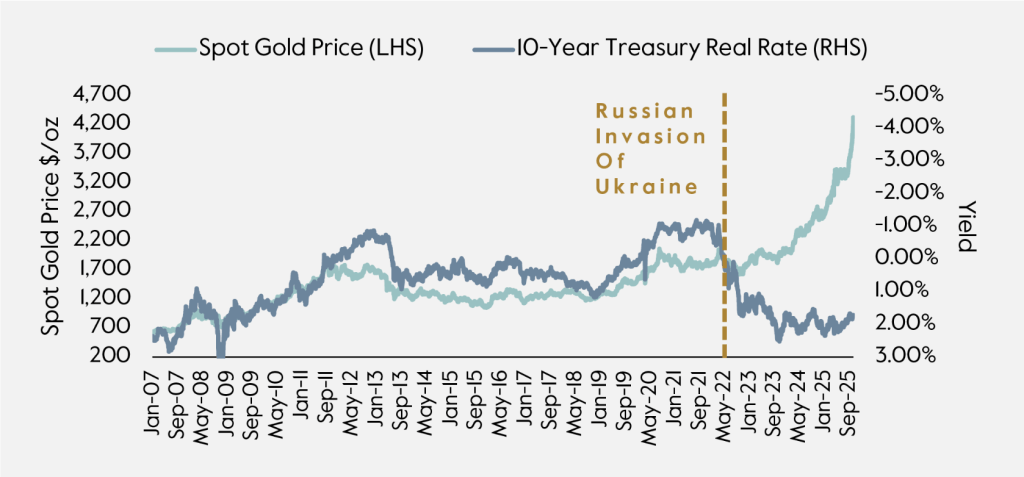
That year marked a turning point. Western powers froze roughly $300 billion of the Russian central bank’s assets, nearly half of its foreign reserves. While official communication at the time emphasized respect for international law and framed the action as exceptional, very few emerging-market central banks took comfort in those assurances. Instead, many responded by reducing exposure to U.S. Treasuries and reallocating reserves toward gold as a form of self-insurance.

That reaction has since proven prescient. More recently, German Chancellor Merz openly advocated using frozen Russian central bank assets to help finance aid to Ukraine—underscoring that such actions are no longer viewed as unthinkable, but as policy options. History offers a stark warning here. Countries whose central bank assets have been frozen—such as Iran, Venezuela, North Korea, Afghanistan, and Libya—have almost never recovered economically. Iraq remains the lone exception, and only after a complete regime change, with fragility still lingering. In other words, for policymakers, this is a risk that must be avoided at all costs. Fool me once, shame on you. Fool me twice, shame on me.

The consequence has been a structural shift in global reserve management. Central banks have simultaneously increased gold holdings while reducing allocations to U.S. Treasuries. In early September this year, when gold reached $3,500 per ounce, it overtook U.S. Treasuries in central bank reserve composition. At today’s price of around $4,500 per ounce, gold accounts for approximately 27% of global central bank reserves, compared with 23% for U.S. Treasuries.

For perspective, in 1970, just before the Nixon Shock ended the gold standard, gold’s share of global reserves stood at roughly 40%. That historical benchmark suggests that, even after the rally we have already seen, the reallocation process may still have meaningful room to run.

What to watch in 2026 are, India has indicated an intention to raise gold’s share of reserves toward 20%, from roughly 16% today. Poland has articulated a target of lifting gold to around 30% of reserves, up from approximately 26%. Turkey continues to view gold as a hedge against persistent currency depreciation and inflation risks. Korea, after more than a decade without increasing gold holdings, has publicly stated that it is considering renewed accumulation. Brazil, where gold still accounts for only about 6% of reserves, has been a notable buyer in recent quarters, highlighting the scope for further diversification.

Second, safe-haven substitution has become a defining feature of this cycle.

For much of the post-2001 period, asset allocation was shaped by a combination of low interest rates, subdued inflation, excess liquidity, and a persistent global savings glut. These forces compressed risk premia across asset classes and supported stable diversification between bonds and equities. Over the past two years, however, these conditions have steadily eroded—and under the current policy trajectory, they are likely to reverse more forcefully and persistently.

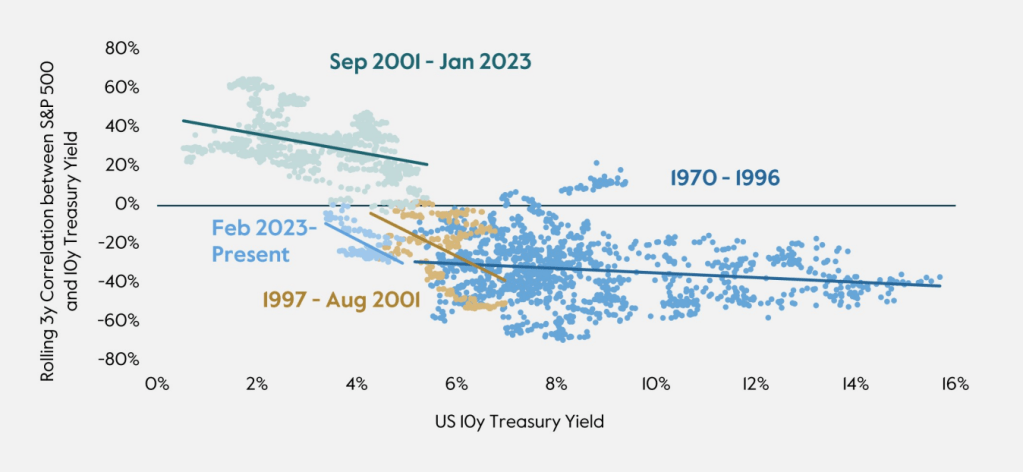
The clearest empirical expression of this shift has been the flip, and subsequent rise, in bond–equity return correlations from structurally negative to decisively positive. In earlier regimes, bonds reliably offset equity drawdowns as negative shocks were translated into easier monetary policy and lower yields. As inflation constraints, fiscal considerations, and supply-side pressures have increasingly limited central banks’ ability to respond symmetrically, that reaction function has weakened. When adverse shocks no longer guarantee falling rates, bonds lose their natural hedging role.

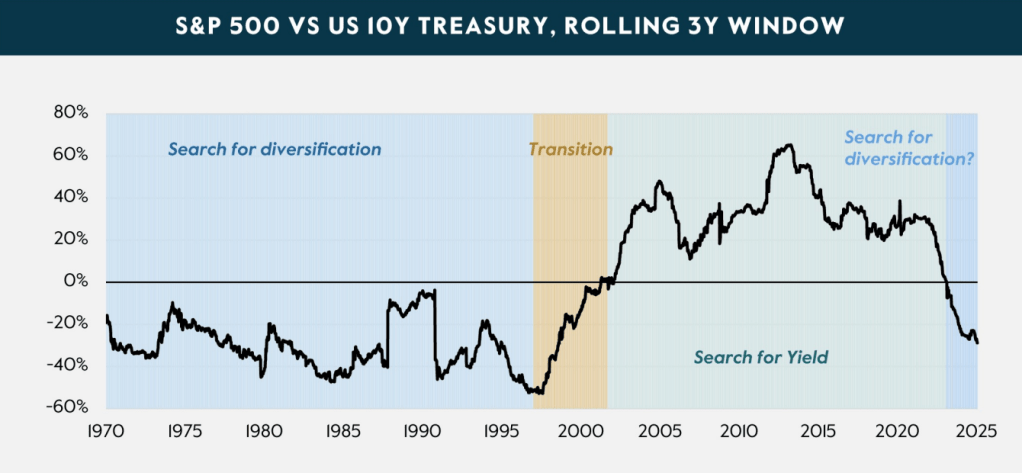
As a result, the traditional 60/40 portfolio is no longer “naturally” diversified. Investors are being forced to look beyond duration for risk mitigation, creating renewed demand for alternative diversifiers—most notably hard commodities, and gold in particular.

That abstraction turned concrete particularly following the April tariff announcements. Rather than triggering the familiar flight into duration, the Treasury market experienced sharp volatility and poor hedging performance. As showed in below, since April, correlations between U.S. Treasury prices and other safe assets, as well as with uncertainty indicators, fell toward zero. This decoupling suggests that Treasuries’ safe-haven properties became more state-contingent, rather than operating as a general absorber of risk. Importantly, this shift appears specific to U.S. assets. Other core bond markets did not exhibit comparable changes. In particular, German Bunds continued to display—and in some cases strengthened—their positive correlation with measures of global risk aversion, underscoring that the episode was not a generalized breakdown of sovereign bond hedging properties.

This results in a vacuum at the top of the safe-haven hierarchy. Capital filled that vacuum decisively. Flows rotated toward gold as a functional hedge. In fact, if we look at a longer period of time in history, safe-haven demand has been allocated across a small set of assets—U.S. Treasuries, the U.S. dollar, and gold, and they substitute for one another at different point in time. At various points in history, the U.S. dollar, U.S. Treasuries, and gold have each occupied the top position in the safety hierarchy. Crucially, substitution tends to occur when one asset enters a visible, long-duration decline—whether through inflation, fiscal erosion, policy constraints, or credibility loss.

Gold’s re-emergence fits squarely within that pattern. Unlike Treasuries, it does not rely on policy easing, fiscal capacity, or foreign confidence of the U.S. to perform its role. As bonds increasingly reflect growth, inflation, and supply risks rather than offset them, gold has been repriced as the residual safe haven—the asset investors turn to when conditional hedges cease to be dependable.

Thirdly, currency debasement, as captured by the real-rate framework, continues to play a persistent but secondary role.

Over long horizons, gold has exhibited a robust inverse relationship with real interest rates, reflecting its function as a non-yielding asset whose opportunity cost is determined by inflation-adjusted returns on cash and sovereign debt. Periods of declining or deeply negative real rates have historically coincided with rising gold prices, as monetary accommodation and inflationary pressures erode the real purchasing power of fiat currencies.

Currency debasement does not require CPI-style inflation. What matters is the erosion of real purchasing power embedded in the risk-free rate. Prior to the GFC, falling real rates were typically associated with physical inflation. Post-GFC, debasement increasingly manifested within the financial system itself—through rising equity and bond prices—rather than through broad-based consumer inflation. From the perspective of real rates, the transmission channel differed, but the implication for gold was the same.

What I would particularly emphasize is the risk of over-relying on the real-rate framework and treating central bank policy as the sole market driver. While real rates remain an important explanatory variable, the current gold market is increasingly shaped by who the marginal buyers and sellers are, and by the nature of their demand.

On the demand side, today’s dominant buyers are central banks as I mentioned in the first part. This includes oil-exporting countries recycling surplus revenues, as well as Asian and Middle Eastern central banks actively increasing physical gold holdings. Crucially, much of this demand is for physical delivery. Gold is purchased, transported, and stored domestically, effectively removed from the tradable float. This creates a form of rigid, cost-insensitive demand that steadily tightens available supply.

On the supply and positioning side, the remaining marginal sellers are disproportionately model-driven investors. Many systematic and algorithmic strategies continue to anchor their positioning to the real-rate framework, expressing short exposure on the premise that sustained high policy rates should suppress gold prices. This creates an asymmetry. As rates rise, these strategies expect headwinds for gold; yet higher rates simultaneously exacerbate concerns around the U.S. fiscal sustainability and balance sheet. Under those conditions, gold can behave in a counterintuitive manner—rising alongside higher rates as it is increasingly priced against sovereign risk rather than monetary accommodation.

In economic terms, this dynamic resembles a Giffen-type behavior: higher “costs” in the form of rising interest rates do not reduce demand, but instead reinforce it by intensifying concerns about the underlying asset backing the system. Each price correction driven by model-based selling has tended to encounter inelastic physical demand, while also forcing short-covering as positions move against expectations. The result is a reflexive process in which pullbacks reduce, rather than reset, upside pressure.

Taken together, this shift in market structure helps explain why gold has remained resilient in an environment that traditional models would have deemed unfavorable. Real rates still matter, but they no longer operate in a vacuum. When sovereign demand dominates the bid and physical supply is progressively withdrawn from circulation, price dynamics become less sensitive to cyclical policy variables and more responsive to structural considerations around credibility, reserves, and balance-sheet risk.

Finally, it is worth emphasizing that gold’s price behavior is inherently multi-layered, reflecting the interaction of several distinct trading logics rather than a single dominant factor.

Over the long run, gold is anchored by structural forces—reserve diversification, safe-haven substitution, and currency debasement. Over shorter horizons, however, its price can be influenced by overlapping and sometimes conflicting narratives, each associated with a different investor base and use case.

In recent months, one such layer has become increasingly visible. Beyond its monetary and safe-haven roles, gold remains part of the broader precious metals complex, which has been affected by renewed enthusiasm around industrial demand linked to the AI and electrification cycle. While gold itself is not a core industrial input in the way copper or silver are, it is nevertheless grouped with precious metals that do have more direct exposure to semiconductor manufacturing, advanced electronics, and energy-intensive technologies. As a result, speculative flows driven by the AI theme have, at times, spilled over into gold, amplifying short-term correlations with risk assets.

This dynamic warrants caution. When gold is partially priced through an “industrial metals” or “technology adjacency” lens, its behavior can temporarily resemble that of growth-sensitive assets rather than that of a pure hedge. In such phases, gold’s correlation with AI-related equities or the broader equity market may rise, potentially diluting its effectiveness as a short-term risk offset. This does not negate gold’s long-term role as a store of value or strategic hedge, but it does suggest that its hedging properties are not invariant across time horizons.

From a portfolio perspective, the implication is straightforward. Gold should not be assumed to provide continuous, linear protection against equity volatility, particularly during periods when thematic enthusiasm—such as the current AI cycle—dominates marginal flows. The asset’s true behavior emerges from the interaction of its monetary, financial, and industrial identities, with the balance between them shifting as market narratives evolve. Recognizing this complexity is essential when assessing gold’s role not just over years, but across the shorter cycles that will likely characterize equity markets in the year ahead.

Thoughts on 2026

Over the past week, the incoming U.S. macro data largely confirmed a continuation of the existing slowdown narrative rather than a meaningful inflection. Backfilled BLS data showed October nonfarm payrolls down 105k, followed by a 64k rebound in November, while the unemployment rate rose to 4.6%, the highest level since 2021. We also saw underperformance in average hourly earnings for the month of November at 0.1%. This brought the year-over-year pace of nominal wage inflation back into the range that defined the pre-pandemic period. In terms of inflation, CPI surprised on the downside in dramatic manner. The year-over-year CPI print came in at just 2.7% and core CPI underperformed expectations at 2.6%. The fact that BLS simply marked some of the changes in OER and the rent components as zero subsequently skewed all of the inflation numbers lower.

Fed policy bias and the outlook for 2026 cuts

Looking ahead to 2026, the Federal Reserve’s policy bias appears increasingly clear: worries on hiring continuing to outweigh inflationary re-acceleration concerns. Employment has become the dominant variable, while inflation as it remains broadly contained, has moved down the list of immediate priorities. Looking forward, the distribution of risks around the jobs market still favor a less restrictive monetary policy stance. And even once Powell’s term is up and we have a new Fed chair, I am expecting that that bias will persist.

At the same time, the Fed prefers owning the front end of the yield curve to the long end of the curve. With government debt levels elevated and refinancing needs rising, maintaining control over short-term rates becomes as much a financial stability consideration as a macro one. Favoring rate cuts or at least resisting premature tightening helps ease debt servicing pressures across the public and private sectors, reinforcing the Fed’s preference for anchoring the front end even if longer-dated yields remain constrained by supply and term-premium dynamics.

equity market considerations for 2026

A more structural challenge sits beneath these near-term policy decisions. Global capital is being aggressively funneled into the AI ecosystem, from semiconductors to data infrastructure. While this investment wave has boosted productivity in select sectors, it has also crowded out employment and consumption growth in more traditional parts of the economy. As capital intensity rises and labor demand softens outside of tech, the Fed is increasingly confronted with data that point to uneven growth—strong at the top, fragile underneath.

This creates a feedback loop that complicates monetary policy. As earnings from major AI companies become macro events that markets trade around, the AI sector has grown too systemically important for policymakers to ignore. In that sense, AI risks becoming “too big to fail” from a market-stability perspective. A dovish fed, intended to support employment broadly, instead channel liquidity disproportionately toward AI and related assets, while offering limited relief to sectors facing structural job losses.

The implication is that, over shorter cycles, monetary policy becomes less effective at addressing real-economy imbalances. Liquidity supports asset prices more readily than it restores employment or consumption in displaced industries. This dynamic raises the risk of further asset-price inflation—even as underlying productivity gains remain uncertain. Heavy capital spending alone does not guarantee a sustained improvement in total factor productivity, and history suggests that such imbalances can eventually surface through higher volatility rather than smooth adjustments.

Against this backdrop, my outlook for 2026 rate cuts is shaped less by traditional inflation metrics and more by labor market fragility and financial stability considerations. The Fed’s easing bias is likely to persist, but its effectiveness may increasingly be expressed through asset prices rather than broad-based economic improvement, setting the stage for a market environment that appears stable on the surface, yet remains vulnerable to sharper dislocations down the road.

Political and fiscal uncertainty as a wildcard

One obvious concern to think about the year ahead is the degree to which the midterm election changes the behavior of the administration. Now we’re going into the midterms assuming that the Democrats take either the House or the Senate and end up with a divided government. This is very consistent with the political wins as well as a typical outcome during the second half of a given president’s presidency. What one would typically think is as a two-term president faces the last two years of his or her presidency with a divided Congress, they would effectively slip into the category of a lame duck or be a placeholder for the next administration. That would typically be characterized by no major initiatives on the legislative front and by a decrease in regulatory changes. Now, that’s a typical environment. Given the current administration’s behavior thus far, it wouldn’t be surprising to see when faced with a divided Congress, the administration tries to further expand the power of the executive branch. Now, whether that translates through to more executive orders and whether or not there’s a concerted effort on the part of the Supreme Court to limit some of the powers of the executive branch all remains to be seen. But, if nothing else, this represents a wild card that could find an expression in the equity market and therefore tighten financial conditions and perhaps more importantly, undermine the wealth effect and thereby cool both inflation and the real economy. According to J. Rangvid, based on current estimates of U.S. household exposure to equities, a 50% drawdown in U.S. equity markets would directly reduce consumer spending by approximately 3.8% and drag GDP growth lower by around 2.6 percentage points. Such a shock would be sufficient to fully offset the historical average growth rate of roughly 2.2%, thereby pushing the economy into a broad-based recession.

Dollar outlook and deficit monetization

Looking into 2026, the U.S. dollar faces growing structural headwinds rather than an obvious bullish catalyst. The Treasury has, for now, helped the Fed navigate a path toward effective deficit monetization, easing funding pressures but reducing the scarcity value of dollars at the margin. This dynamic, combined with a Fed that continues to prioritize labor market risks over inflation concerns, limits the upside for U.S. rates and weakens one of the dollar’s key sources of support.

At the same time, persistent fiscal deficits and heavy Treasury issuance are gradually weighing on sentiment toward dollar assets, even as global alternatives remain imperfect. While the dollar is unlikely to break down sharply given its reserve status, it is also difficult to make a convincing case for sustained strength. The most likely outcome for 2026 is continued range-bound trading with a mild downside bias, driven by easier financial conditions and ongoing deficit financing rather than a dramatic shift in global growth or risk appetite.

Dovish Fed and What’s Going on with Liquidity?

In the week just past, the most relevant macro event came in the form of the FOMC decision to cut policy rates by 25 basis points, widely characterized as a “hawkish cut,” accompanied by an unchanged dot plot implying only one additional cut in 2026. However, the market largely discounted the dots, viewing them as stale given all of the uncertainties surrounding the macro narrative over the course of 2026.

While the initial communication was in keeping with this notion that this week’s cut was something of an insurance measure, what we heard from Powell was taken far more dovishly by the market as the chair acknowledged that the persistent inflation risks resulting from tariffs have not been as severe as initially feared, and there is still plenty of concern around the state of the labor market, which means that the Fed is going to need to continue normalizing rates. Afterall Powell is still in easing mode.

In the meantime, the Fed surprised the market with an earlier-than-expected activation of its Reserve Management Purchase (RMP) program, effectively hedging liquidity risks that showed up as year-end funding pressures emerged. While expectations around the pace and scope of rate cuts in 2026 have cooled, the Fed delivered a more dovish liquidity package than anticipated by announcing the start of RMPs sooner and at a larger scale. In the first month alone, the Fed committed to buying around $40 billion of short-dated Treasuries under three years and signaled that elevated purchasing levels would persist in the months ahead.

This decision came against a backdrop of volatile Treasury General Account (TGA) balances as the government reopened and a sustained decline in reserve balances—recently slipping below 13 % of commercial bank assets. The recent liquidity stress has been pretty visible in risk assets. Bitcoin, often viewed as a liquidity-driven risk barometer, has broken below key technical levels and exhibited heightened volatility.

Part of liquidity tightness can be traced to strategic balance sheet moves by the notably JPMorgan’s withdrawal of roughly $350 billion from its Federal Reserve deposits to buy Treasuries ahead of expected rate cuts. By redeploying these reserves into government debt, JPMorgan materially reduced system-wide reserves, contributing to tighter money market conditions and higher repo rates before the Fed’s liquidity interventions.

The reserve management purchases at $40 billion a month began on the 12th of December is a clear effort on the part of the Fed to support the bill market. I have to mention, using the Fed’s balance sheet to effectively monetize the deficit has long been a risk. And now that it has come to fruition, the takeaway is it’s not a significant market event. It will be interesting to see whether or not the Fed ultimately needs to increase the size of these purchases, but for the time being, $40 billion did air on the higher side of many estimates. The reserve management purchases also came earlier than the market had anticipated, although it does follow intuitively that the Fed would want to get ahead of any potential year-end funding strains.

In fact, a bigger surprise was the language contained in the implementation note, which included the potential for the Fed to buy securities with maturities up to three years. Now, we did see the upcoming month’s purchase schedule released, and it didn’t include anything other than bills, but in interpreting the steepening of the curve, the fact that two and three year notes may potentially be eligible to be purchased, with obviously an emphasis on flexibility from the Fed’s perspective, certainly contributed to the front-ends out performance in the aftermath of the FOMC. And we’ve already had enough conversations about why this is not a QE program, but nonetheless, the slightly longer maturity profile of what might be purchased in the RMPs represented new information that was not the consensus around what the program would look like going into the Fed.

Taking a step back, and I think it’s important to put the Fed’s decision in the context of what the Treasury Department has been messaging in terms of its issuance intentions. It is notable that one of the market’s biggest concerns from a bond bearish perspective over the course of the summer had been the growing deficit and the forward implications for Treasury issuance. When coupled with the fact that Bessent has clearly communicated the Treasury Department will be primarily utilizing the bill market to fund the deficit, this brings us back to one of our key observations about the interplay between the Treasury Department and the Federal Reserve at the moment. And that is that Bessent has effectively forced the Fed into monetizing the deficit. Now with reserve management purchases, the new norm, it’s not QE, but it is expanding the Fed’s balance sheet, we suspect that it will be difficult for the Fed to back away from those programs for the foreseeable future. And looping this back to the concern that these purchases going potentially all the way out to the three-year sector, as the November refunding statement outlined, while the Treasury Department will be focused on bill issuance over the next fiscal year, come fiscal year 2027, which is November 2026, front-end coupon auction sizes are likely to increase, while 10s, 20s and 30s are more likely to be stable. So in the vein of the Fed monetizing the deficit, policy makers have left open the window to extend that all the way out to the two or three-year sector.

Well, after we spent a lot of time discussing who might it be that would serve as the incremental buyer of treasuries, turns out his name is Kevin Hassett.

And he’ll take two.

What Could Push 10-Year Yields Higher from Here

Employment is back in the driver’s seat—and inflation has been politely asked to move to the back. This week’s market narrative is a familiar one, but with a few important twists: labor data continues to soften just enough to keep the Fed on an easing path, and inflation remains well-behaved enough to stay out of the headlines. But beyond the policy debate, there’s a quieter development worth flagging, the triangular consolidation in 10s. Yields haven’t broken lower, they haven’t broken higher, and yet the range keeps tightening. Whether this is simply a pause, or the market coiling for something more directional—is the question lurking beneath an otherwise calm surface.

Employment in the driver seat

In the week just past, the economic data cemented expectations for another 25 basis point rate cut when the Fed meets on December 10th. Specifically, ADP for the month of November showed a decline of 32,000 jobs. This largely served to reinforce the notion that we’re in a no hire, no fire labor market at the moment. Consistent with this was an unexpected drop in initial jobless claims to 191,000. We also saw the Revelio Labs print at negative 9,000 for the month of November, and that compares with a downwardly revised negative 16,000 in October. Overall, the theme for the employment proxies has been mixed to weaker. As a result, not only has this firmed up expectations for a Fed rate cut, but it also reduces the probability that Powell strikes a particularly hawkish tone at the press conference.

This dim outlook is reinforced by the continued headlines about large-scale layoffs and of course the employment proxies. It’s also worth noting that within the ADP series, we saw all of the job losses coming from smaller businesses. This is very consistent with the fact that smaller businesses are reportedly suffering more from tariffs and the trade war uncertainty. It will be worth following this series to see if, in fact, those job losses spread to medium and large size firms in the near term.

At some point over the last several weeks, there was lots of doubt that the Fed was going to be bringing rates lower. But between some of the rhetoric from the likes of William and Waller, coming into this week, we saw a return of market pricing to nearly 100 percent odds of another 25 basis point cut in December. Now this leaves the question of how Powell is going to characterize next week’s cut. Is it going to be of the insurance variety or is it simply the latest step on the journey closer to neutral? At this stage and looking out into 2026, it’s that dynamic which is occupying the attention.

Well contained inflation

As the jobs data is in the driver seat for the Fed, market has moved past peak reflationary angst that really characterized the summer months in the treasury market. We have now seen that there was some tariff pass-through, but it has been reasonably well-contained. And perhaps more importantly, the core inflation measures haven’t managed to materially accelerate to the point of becoming troubling for the treasury market or monetary policy makers. For evidence, we looked to 10-year breakevens, which are still sub-225 basis points. Now, when we look at this series over a 25-year history, the average is 207 basis points. So we’re still above the long-run average, but nowhere near the 300 basis point peak seen during the pandemic.

As long as tariff pass-through is spread out over a longer period of time, then we won’t see forward inflation expectations reset to a materially higher plateau. In fact, in considering the year ahead, as the realized inflation data comes in, I expect breakevens to drift lower. When looking at the period between 2014 and the end of 2019, what I see is that breakevens averaged 178 basis points. I am using this as a medium-term target for break-evens once the market is convinced that inflation has in fact, not only not reaccelerated because of the trade war, but also continued to moderate as some of the key distortions created by the pandemic have worked their way out of the real economy.

A Triangular Pause in 10s

With the above backdrop, there is still one important caveat when it comes to the treasury market, and that caveat remains the global sovereign debt complex. As we’ve seen across JGBs, EGBs, and gilts, yields have displayed a notable stickiness to the upside. While U.S. Treasuries have partially decoupled in recent weeks, the broader global fixed-income landscape continues to cap the downside in U.S. yields, making it difficult for the 10-year to sustainably trade below the 4% threshold. In other words, this is not an outright bond-bearish environment, but it is one that has constrained the scope for a more meaningful rally.

Technically, this dynamic has manifested itself in the 10-year yield consolidating into a tightening triangular formation, with lower highs pressing down against a firm floor near 4%. Volatility has compressed, signaling that the market is increasingly coiled for a directional move, even if conviction on timing remains limited. Importantly, this consolidation reflects not just uncertainty around Fed policy, but also a balance between domestic disinflationary forces and persistent global term-premium pressures.

While the baseline case still favors range-bound trading, the risk of an upside resolution cannot be ignored. A break higher in yields would likely be driven less by U.S. inflation re-acceleration and more by external or structural forces—including renewed upward pressure from global sovereign markets, the AI capital expenditure, increased Treasury supply absorption challenges, or a resurgence in term premium as liquidity conditions tighten. In that sense, any upside move in yields would look less like a growth scare and more like a plumbing-driven repricing, consistent with a world where global borrowing costs remain structurally higher.

Bad Jobs, Bad Spending, Great Rallies

soft labor data, weak consumption, and subdued inflation

In the week just passed, without question, the most interesting developments and market relevant ones came from the economic data. First, we had the weekly ADP series, which showed the four week moving average at negative 13.5 thousand jobs. That marked the lowest since August. And given that it was for the week ended November 8th, it did provide the market with yet another reason to be concerned about the overall state of the employment market. It dovetailed well with the notion that the Fed will be cutting 25 basis points when it meets again on the 10th of December. Keep in mind that we will see the full November data series from ADP in the week ahead on December 3rd, and that will help level set expectations for the Fed.

We also saw a disappointing retail sales print for the month of September, which was not surprising to me as the two brokers with access to credit card data gave exceptionally low estimates. Here, the control group dropped for the first time since April, printing down 0.1% on a monthly basis. That was versus a 0.3% anticipated increase. Recall that this series is not inflation-adjusted, and as a result, when translating this back into real terms, the implication for real consumption will be even weaker.

PPI, particularly on the core side, came in below expectations as well, printing up just 0.1%. When combined with the CPI data we already have in hand, this gets us to a solid 0.2 for core PCE during the month of September, consistent with further disinflation.

The combination of soft labor data, weak consumption, and subdued inflation has strengthened market pricing for additional easing, driving a bullish Treasury reaction, particularly at the front end, with 2-year yields dipping below 3.50% and 10s gravitating toward 4%.

distributional challenge

If the headwinds for the labor market intensified into the end of the year, that could quite readily get the Fed back into rate cutting mode. There’s also this notion that the wobbles and the equity market have been sufficient to bring financial conditions back on the Fed’s radar and reinforce the idea of an insurance cut.

And it goes beyond simply the intuitive feedback loop between risk asset volatility and financial conditions and instead highlights the broader challenge that the Fed is constantly chasing in terms of needing to set monetary policy for economic participants that are not experiencing risk asset appreciation or the wealth effects influence to the same degree. Lower wage earners that obviously have less exposure to the upside scene in equity markets and are also facing the greatest job uncertainty and the most material impact in terms of household balance sheets from inflation are in a far different place in terms of the ability to consume and ultimately drive growth than a first or second quartile household who has realized impressive real estate appreciation, stock market appreciation, wage growth, and is probably a bit more secure in the employment market. Which of these categories is in the driver’s seat in terms of dictating how the Fed sets monetary policy? On the one hand, reducing restriction to acknowledge the challenges faced by lower income households will only then fuel easier financial conditions, higher asset prices, and an exaggeration of the wealth effect and consumption positive influences with what that means for inflation for upper quartile households. It’s this push and pull that is going to become especially relevant in 2026, given one, the outright level of stocks and two, the potential inflection point that we’ve reached in terms of the trajectory of inflation and the direction of monetary policy.

Actually, one of the reasons that the Fed is so focused on not the overall employment landscape, but specifically the unemployment rate, is that the unemployment rate, which is currently at the highest since October 2021, represents the most acute risk for the bottom quartile, i.e. an acceleration in unemployment that makes it more difficult for the low skilled, low wage earners to remain in the labor market. That would have a direct implication on consumption. However, we’re reminded that the top 10% of consumers account for 50% of consumption in the US., which indirectly begs the question, is the Fed the central bank to the entire economy or the central bank to the stock market? Or the central bank to the primary drivers of demand-side inflation?

A Wider Path to A December Cut

This week, with the futures market was pricing in just a 25% probability of a December rate cut on Wednesday and equity market dropped 4.6% intraday, we finally got some official data release come in to process on the employment side.

Mixed September Job

The form of the September nonfarm payroll payrolls print, which increased 119,000 jobs. This was well above the consensus, which was for 51,000. In addition, the three-month moving average for headline payrolls increased to 62,000 from a downwardly revised 18,000. On its surface, the payrolls report should have been a net negative for the Treasury market. However, on the other hand, what we saw within the details was an unexpected increase in the unemployment rate to 4.4%. On an unrounded basis, it was 4.44%, which effectively means it was close to rounding up to 4.5. Even as it printed, it was the highest unemployment rate since October 2021. Taking some of the edge off of the higher unemployment rate was the fact that the labor force participation rate increased one-tenth to 62.4%. However, at the end of the day, what we saw was 33,000 jobs removed on a net two month revision basis and an unemployment rate that has now reached its highest level since October 2021. But nonetheless, there was enough underlying softness in the September jobs numbers to trigger.

In the wake of the payrolls data, those odds of a December cut had increased to 40%. Now it’s clear that within the employment report, there was something for both the hawks and for the doves, and so I see the release as inconclusive as it relates to December. At the end of the day, I suspect that the path toward a December rate cut in fact got wider, but still largely be a function of the ability of the doves to convince the hawks that another quarter point is warranted before year-end.

Equities as the De Facto Policy Signal

By late November 2025, equity markets had entered a sharp and disorderly sell-off, reversing much of the optimism that had characterized earlier months. What began as a reassessment of stretched valuations quickly evolved into a broader risk-off episode, amplified by thin year-end liquidity and growing uncertainty around the macro and policy outlook.

This has naturally shifted the focus toward the performance of the equity market and an increasingly uncertain outlook for risk assets as we approach year-end. The well-worn narrative around business investment tied to AI, data centers, and marquee technology earnings has done little to arrest the recent drawdown. To be sure, the S&P remains comfortably positive on a year-to-date basis, a level of equity performance that, in isolation, would not typically warrant a monetary policy response. Yet it has been telling that a growing share of discussions has centered less on upside potential and more on valuation risk.

Over these past few weeks, it is increasingly centered on stock valuations and just how much downside will be realized if there is a bit of a rationalization of some of the exuberance that’s driven equities to these levels. Extrapolate that backdrop onto an FOMC decision where the Fed may in fact choose to hold rates steady and it’s not difficult to draw the correlation to periods of monetary policy cycles past. We’re heading into the end of the year, there’s risk off impulses that the Fed does not react to, which only then exacerbates the risk off move heading into December 31st, only to have a relatively quick dovish shift, faced early in the new year.

It is, of course, far too early to assert with high conviction that this precise sequence will unfold between now and New Year’s Eve. Still, it is increasingly evident that the U.S. rates market is looking beyond traditional macro releases and taking its cues from equity market dynamics, treating risk-asset performance as an important guide to the Fed’s reaction function in the weeks ahead.

2023, A Year To Be Defined by Range Trades

It has been a while since my last post. However, given the significant data releases that we have witnessed this year so far, including the impressive nonfarm payrolls report, slightly higher than expected inflation data, a rebound in services ISM and the solid retail sales, it is prudent to pause and provide an updated view on the rates market, which will ultimately impact the performance of risk assets that we are pondering as of now.

From the Pivot Trade to “Higher for Longer”

In February, the major economic data was nothing if not strong, Not only was hiring very strong in January, inflation very elevated in January, but also spending was very robust. The real economy is performing in such a way that will give the FOMC ample cover to continue raising policy rates and more importantly, retain a higher terminal rate for a longer period in this cycle.

On top of that, we saw the treasury market extended its bearishness, a impressive backup in 10 year yields from the 3.33% level. And the next primary uncertainty as it relates to the price action is the degree to which any further selloff beyond 390 through 4% or beyond can extend along with this latest down trade. Remember in January, the it trade in treasuries was pressing the Fed pivot and calling into question Powell’s commitment to bring rates above 5%, which is now given way to a resumption of the bear flattening trend that we’ve seen in the curve with 2s 10s back below negative 80 basis points this week and rates in the front end and belly of the curve the highest we’ve seen all year.

Taking Advantage of the Outsize Moves

It’s important to keep in mind that historically once the fed reaches the end of a cycle, whether it’s a hiking cycle or a tightening cycle, 10 year yields tend to hold a range of roughly 120 basis points. In that, I would expect this year to be defined by a range trade for 10 years centered at 3.50% with a range around the center point of plus or minus 60, 65 basis points based on the cycle high of 4.34% with a terminal of 6% priced in and the 3.33% low when the dovish pivot trade was so hot at the beginning of the year. That means it’s very reasonable to anticipate that at some point, whether it’s via renewed economic optimism or stubbornly high inflation, that a four handle will come to fruition, which will represent an important buying opportunity. On the flip side, whether it is a more quickly decelerating inflation profile and or a higher probability of a hard landing, it’s very reasonable to assume that a two handle for tens should be on the table as a risk if nothing else. Similarly, that would be an extreme that would warrant fading, i.e. selling 10s in that environment.

Let us not forget that the feedback loop between the equity market and overall financial conditions as the year plays out. Besides the fact that bond yields are an important determinant of equity valuations, the reality of higher borrowing rates for businesses and the lingering implications from the higher cost structures that have been established because of inflation during 2022, while firms were able to push through a portion of the higher input costs, they were not able to push through all of the higher costs. Instead, what we’ve seen is that the macro narrative continues to drive the compressions that come from valuation and profits for the pricing of risk assets. What’s been notable is that despite this dynamic, equities are not off as much as we might have otherwise expected. I would expect risk assets to experience a larger correction as 10 year continue to push through that 4% level. Again, as we learned in 2022, if employment continues to show resilience, a slow and steady grind of the equity market that contributes to the cooling down of inflation through the wealth effect is certainly welcome from a monetary policy perspective. While in the coming weeks, when the 4% of 10 year yield is breached and a meaningful amount of dip buying interest emerged, we will likely see a rally in treasuries, which will bring stocks back on the upward trend again. My ultimate trading bias for 2023 at least for the first couple of months remains to take advantage of the outsized moves to the range extremes.

Hard Landing vs. Soft Landing vs. No landing

It certainly was a defining week in terms of the price action itself and it certainly is not lost on me that at the beginning of this year when the it trade was bringing forward the Fed pivot, the conversation was hard landing versus soft landing. Fast forward to today and the conversation has shifted to soft landing versus no landing. I certainly don’t think that this is warranted given the amount of cumulative policy tightening that has already occurred, not only in the US but also globally. There is a lag between the actions of global central banks and the impact on the real economy and the market seems to be content to assume that that has already filtered through the system. As Jeremy Grantham said earlier that at this stage, there are more things that can go wrong than there are that can go right globally.

Now we still have more than a quarter point of easing assumed by the market. I will caution against interpreting the 25 basis points of easing seen in the Fed fund’s futures market as 100% probability that the Fed is going to cut by a quarter point. Instead, I will go with the interpretation that it’s either a 25% probability that they’ll need to ease by 100 basis points or a 12.5% probability that they need to cut by 200 basis points by year-end. Now, in the latter scenario that would clearly imply a much more significant economic downturn and a Fed that was forced into action long before they currently anticipate. So that being said, when and what would it be?

Eye A Bottom, Volatile Months Ahead

In the week just passed, the financial markets received a lot of new fundamental information from which to derive a sustainable trading direction. We saw the FOMC decision to increase policy rates by 75 basis points, which was largely in line with consensus. We also heard from Powell at the press conference that the Fed is cognizant of the risk of a recession. However, the risk of elevated inflation expectations far outweighs the risks of a slower economy. We also learned that real GDP during the second quarter contracted 0.9%. Now this is on top of the -1.6% print that we saw in Q1.

Recession?

Now we’ve seen two back-to-back quarters of negative GDP. That has typically been the rule of thumb for a recession. However, even at the press conference, Powell made it very clear that the US economy is not in a recession, given how low the unemployment rate is and other aspects of the economy that continue to show ongoing strength. That’s not untrue as GDP isn’t the only measure that matters, especially in the tangled mess of the pandemic economy. The National Bureau of Economic Research (NBER) has the final say on whether a period of economic decline is a recession, but a determination that can lag for months. I would like to remind everybody that since 1948, among all ten technical recessions, none of them was not a NBER recession. And there has been 2 out of 12 NBER recessions that didn’t experience two consecutive quarters of GDC slow down being 1960 and 2001.

The one caveat here is,  if looking at the leading indicators, we continue to see disappointing consumer confidence numbers, a softer ISM Manufacturing PMI, and the upward pressure, albeit modestly, on initial jobless claims. Though Powell conceded that while the Fed does not intend to trigger a true recession and he sees a path forward that doesn’t involve a recession, that path has just gotten a lot narrower. The concern embedded in that assumption is that the Fed can tweak the unemployment rate higher without overshooting. Again, very difficult to engineer a soft landing and if history is any guide, the Fed is more likely than not to overshoot and trigger a meaningful recession sometime within the next 18 or 24 months.

Rebound of Duration and Risk Assets

As a result, it’s not surprising to see an increase in growth concerns manifest themselves in the form of lower Treasury yields, specifically a round of bullish re-steeping, especially once investors saw the negative GDP print for the second quarter. Despite the fact that Powell said 75 basis points is on the table for September, we’re now seeing the Fed Funds Futures Market, the front end of the coupon curve, and the overall shape of the rates landscape now reflect a much less aggressive presumed path of hikes from here. 10-year yields got to that 2.64% level, representing the lowest level that rates have been in several months. And more importantly, reinforcing the idea that the yield peaks for the cycle are in, and for tens, that is 3.50% and that any path to a 3.75% or 4% 10-year yield level is going to need to be revised or quite frankly, pushed forward to the next cycle. With the drawback in 10 year yields and anticipating the Fed’s hawkishness off the peak, we also saw a meaningful rebound in risk assets.

Where to go from here?

To me, the September question is still between 50 and 75 basis points, although admittedly, we do still have next week’s NFP data, two more CPI prints, and of course, August’s employment data as well that we’ll get in early September that will help refine the market’s collective expectation for just how quickly Powell will get to terminal. Though the market is pricing quickly reversing monetary policy with optimism, I would argue that the Fed will continue to maintain terminal for longer during this cycle than the market currently anticipates. One underlying motivation for that is that the Fed truly wants the balance sheet runoff to go as long as it can, and the Fed can’t cut rates while the balance sheet is unwinding in the background, certainly not if prior episodes are any guide. So this implies that once we get to 3.25%, that’s going to be static even if we start to see the unemployment rate overshoot the Fed’s expectations for this year and into 2023.

Nothing wrong with trading the rebound given that the market has digested the weaker than expected growth data. Waiting for the economy to bottom has historically been a mistake. Stocks have typically been up from their trough by the time the economy bottoms. The only question is, we should long, until when? 🙂

Optimistic Equity vs. Inverted Yield Curve

In the week just past, the Treasury market sold off in a rather dramatic fashion and we saw a couple key benchmark curves invert along with the significant flattening. The week also saw an impressive market reaction to Powell’s Monday morning speech in which he more resolutely laid out the case for a 50 basis point rate hike in May and maybe even in June as well. And when the Chair was asked, “What could prevent the committee from going 50 in May?” he gave a very clear answer in, “Nothing.”

Beware of Overoptimism in Equity Markets

Clearly, the rate markets have priced to a more aggressive policy rate normalization path because if we get a 50 basis point hike in May, we’re certainly going to price in a 50 basis point hike in June, as well as the realities of the balance sheet runoff, which is expected to be announced as early as the May FOMC meeting. While at the same time, equities have managed to hold in remarkably in such an environment. The fact that the S&P 500 returned to 4,600 to me does reflect a great deal of investor optimism, which I think is worth exploring in a little bit of detail in today’s blog. All else being equal, I would have expected Powell’s hints at a 50 basis point hike in May to have had a much more meaningful impact on stocks.

The traditional narrative is anything that monetary policy makers do to curtail inflation comes at the expense of growth and eventually the jobs market. Unlike most of the central banks in the world, the Fed has a dual mandate, which is to promote both price stability and full employment. So, as we have seen, this created a unique set of challenges for the Fed during this particular cycle. What Powell has done is he has reframed the impact of inflation on the employment market. Specifically, the Fed’s mantra now is that price stability is key for continued hiring. By effectively recalibrating market participants’ expectations for what “a good policy response” would be, the FOMC has created a trading environment in the equity market in which everything that is hawkish but ends up being risk-on simply because Powell and the Fed are now aggressively fighting what has been identified as the biggest risk to the real economy. However, that doesn’t mean that an extreme hawkish fed and tighter monetary policy won’t ultimately curtail growth, but for the time being the equity market is trading it as such.

The question is, when will the optimistic equity investors eventually realize it? In practical terms, if we start to see a more meaningful hit to earnings with the backdrop of higher borrowing costs that’s going to create a more significant repricing in risk assets. And being aware of this potential earning risks, investors and traders will hedge their positions ahead of the release. A two-week window sounds very reasonable to me.

Key Benchmark Curve Inversion

In the past week, we have also seen a couple key benchmark curves in the Treasury market invert, notably the 5s-10s dipped below zero for the first time in the cycle, which is very consistent with what we’re seeing in terms of the flattening of the yield curve. We saw 2s-10s below 20 basis points and 5s-30s the flattest than it’s been since 2007. Now, for context, one of my convictions for this year has been a flattening of the yield curve to the point of inversion in 2s-10s. Now, my baseline assumption is that 2s-10s will eventually invert sometime between now and the May FOMC meeting. If and when this occurs, the bigger question will quickly become, how far can 2s-10s invert given that it’s occurring much earlier in the cycle than we would have otherwise expected? Well, the lower bound historically has been roughly negative 20 basis points.

3M-10Y/2Y-10Y Divergence

One interesting aspect of the flattening we’ve been seeing is that there are two key measures of the yield having veered in opposite directions. While when we think about the shape of the yield curve and what it implies for the performance of the real economy, the market investors tend to focus on the 2s-10s spread, but the Fed research supports the idea that the most relevant curve is three-month bills versus 10-year yields, which currently stands at roughly 188 basis points. Some may argue that the divergence is sending mixed recession signals, but the caveat there being that three-month bill yields tend to move lockstep with policy rate. So, if we do see 50 basis point rate hikes in May and June, that will get that spread to 88 basis points, to say nothing of the fact when the Fed starts to unwind SOMA. The incremental supply in the bill market will push rates even higher, contributing to further flattening in three-month bills versus 10s. So my base case is that the 3M-10Y curve will soon begin to flatten as the tightening policy that the Chair has laid out unfolds in May and June.

Headline Inflation Set to Stay High

We also got the 10-year TIPS reopening last week, which tailed 1.8 basis points. Analysts think it’s fair to characterize the result as decent. But what really interests me is, what does that strong demand for inflation protection at this moment in the cycle mean to the inflation outlook, especially given the increasingly hawkish Fed backdrop that we’ve been talking about?

Obviously, the market participants believe that there are types of inflation that will not be responding to the tighter Fed policy, to which I feel very sympathetic. All in all, the Fed doesn’t pump oil and the Fed doesn’t grow grain. A higher Fed funds target band is going to do little to alleviate the pressure in the oil market, or the upside in food prices that are resulting from the disruptions in Europe and the role that Ukraine plays in global food supply chains. So, even if the Fed is able to effectively combat rising core inflation, it’s not unreasonable to assume that we’re going to see higher headline inflation for a little bit longer timeframe. And in this context, given the fact that TIPS are linked to headline CPI, it was telling me that we saw good auction demand, despite a Fed that is clearly committed to do what it can to contain higher consumer prices.

Inflation Expectations Anchored, for Now

In the week just past, the treasury market went through a meaningful round of consolidation in so far as after 10-year yields backed up to roughly 180. I won’t go that far to interpret the slight bullish drift as any broader tone shift, other than simply to acknowledge that bearish repricing have a tendency to occur in a step function as opposed to simply being a one-way move to a sustainably higher rate plateau. In other words, a 25 basis point sell-off followed by a round of consolidation before attempting to press yields even higher is very consistent with the way that the treasury market has historically traded. Especially given that it’s still very early in the quarter, very early in the year, the idea that all of the bearish positions that are going to be established have been established doesn’t really resonate.

The consensus tightening timeline

And as the year is progressing, we are getting a greater degree of clarity on what path monetary policy normalization will probably end up taking. Governor Waller was out later in the week saying that as a baseline, he still favors three rate hikes in 2022 and Chicago Fed President Evans said the same thing. So from that perspective, at this point, it seems that the consensus tightening timeline is a 25 basis point rate hike in March followed by another 25 basis point move in June. And then a period exactly as Waller said to evaluate what the inflation landscape looks like before delivering balance sheet normalization in September. And then with all the applicable pandemic caveats considered, another rate hike in December.

And while there does seem to be consensus forming around the timing of rate hikes and the balance sheet runoff announcement, there’s a fair amount of divergence in terms of market participants’ expectations for exactly what the balance sheet rundown will look like. The question is whether the caps are achieved immediately for the balance sheet rundown or if they stagger in over time. And if they do stagger in over time, will it be a 10, 12-month period before we reach the maximum runoff velocity or will it be four or six months? Assuming that it will be a four to six-month timeframe would be more acutely focused on the way in which the Treasury Department will choose to fill any funding gap. All else being equal, if the roll off runway is longer, the impact on the Treasury Department’s borrowing needs in 2022 will be much less significant and easily absorbed in the bill market. In the event that we reached the caps in 2022, I think then the Treasury Department has a lot more or weighty decisions to consider in terms of where they increase issuance.

A Close Look at the yoy CPI

When looking at the CPI print, the details were very much in keeping what it is we’ve been seeing throughout the bulk of the pandemic. A large portion of the gains were centered in OER and used auto prices. What I will find fascinating is what would happen when the base effects hit in the second quarter and the year-over-year inflation figures become less headline-grabbing than they have been recently. By then we’ll be at a point where the Fed has already started the rate normalization process. And if we find ourselves an environment where the yearly inflation numbers are moderating somewhat, it will, if nothing else take some of the urgency out of the Fed’s tightening campaign.

What’s quite intriguing was the market’s knee-jerk response to the CPI prints. At a first pass, higher than expected prices should have exacerbated the sell-off that we’ve been seeing. But instead, what we saw was actually a knee-jerk draw up in yields still well above 170 in the 10-year space. One can characterize that as a version of a strong inflation print already being priced in. I would add that headlining core inflation were above consensus, but not so far above consensus as to imply that the market’s expectations for Fed hikes would be insufficient to counter the rise in consumer prices. So what the market is saying is that as long as inflation continues to increase at the pace it has been and doesn’t accelerate even further, the Fed’s 25 basis point a quarter cadence with a balance sheet runoff sometime later this year should be sufficient to keep inflation expectations anchored. And at the end of the day, that’s really the Fed’s primary goal at this moment. That’s also in line with the rising real rates and the fact that breakevens have continued to moderate dropping below 250 over this past week, which has got to be encouraging for monetary policy makers if only because it indicates that the market is showing faith in the Fed’s ability to offset higher inflation.

I would maintain that one of this year’s primary theme will still be the flattening of the curve, particularly 5-30s as pricing in a full tightening cycle results in upward pressure on rates in the front end of the curve, while the ramifications of a less accommodated monetary policy contain how far 10 and 30-year yields are able to back up as the global economy continues to struggle with the coronavirus. And all of the associated implications for both real growth, as well as the implications for a higher inflationary environment at least in the near-term.